
The 2025 Indian River Lagoon Report is an annual health assessment of the Indian River Lagoon (IRL) and is the evolution of the Marine Resources Council (MRC) Report Card, first published in 2016. In 2024, MRC scientists re‑imagined the Report to assess harmful algae, seagrass coverage, sediment health, wastewater spills, and water quality with data gathered from partner and government organizations. This year’s Report follows the 2024 format with the addition of a sixth habitat health metric: salinity.
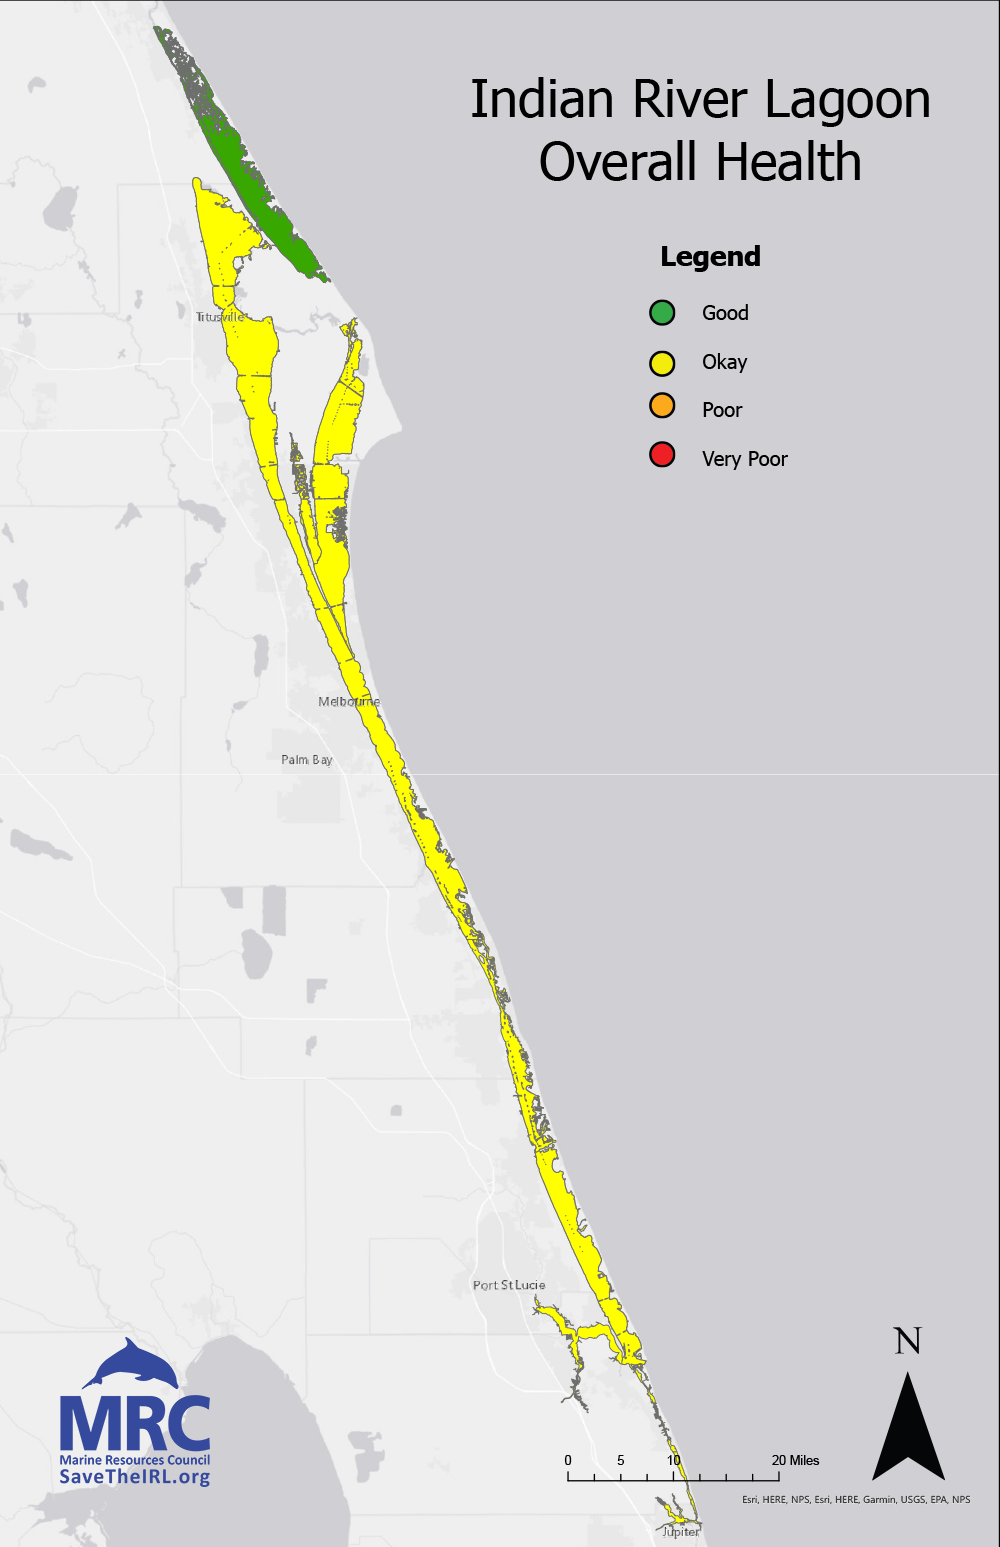
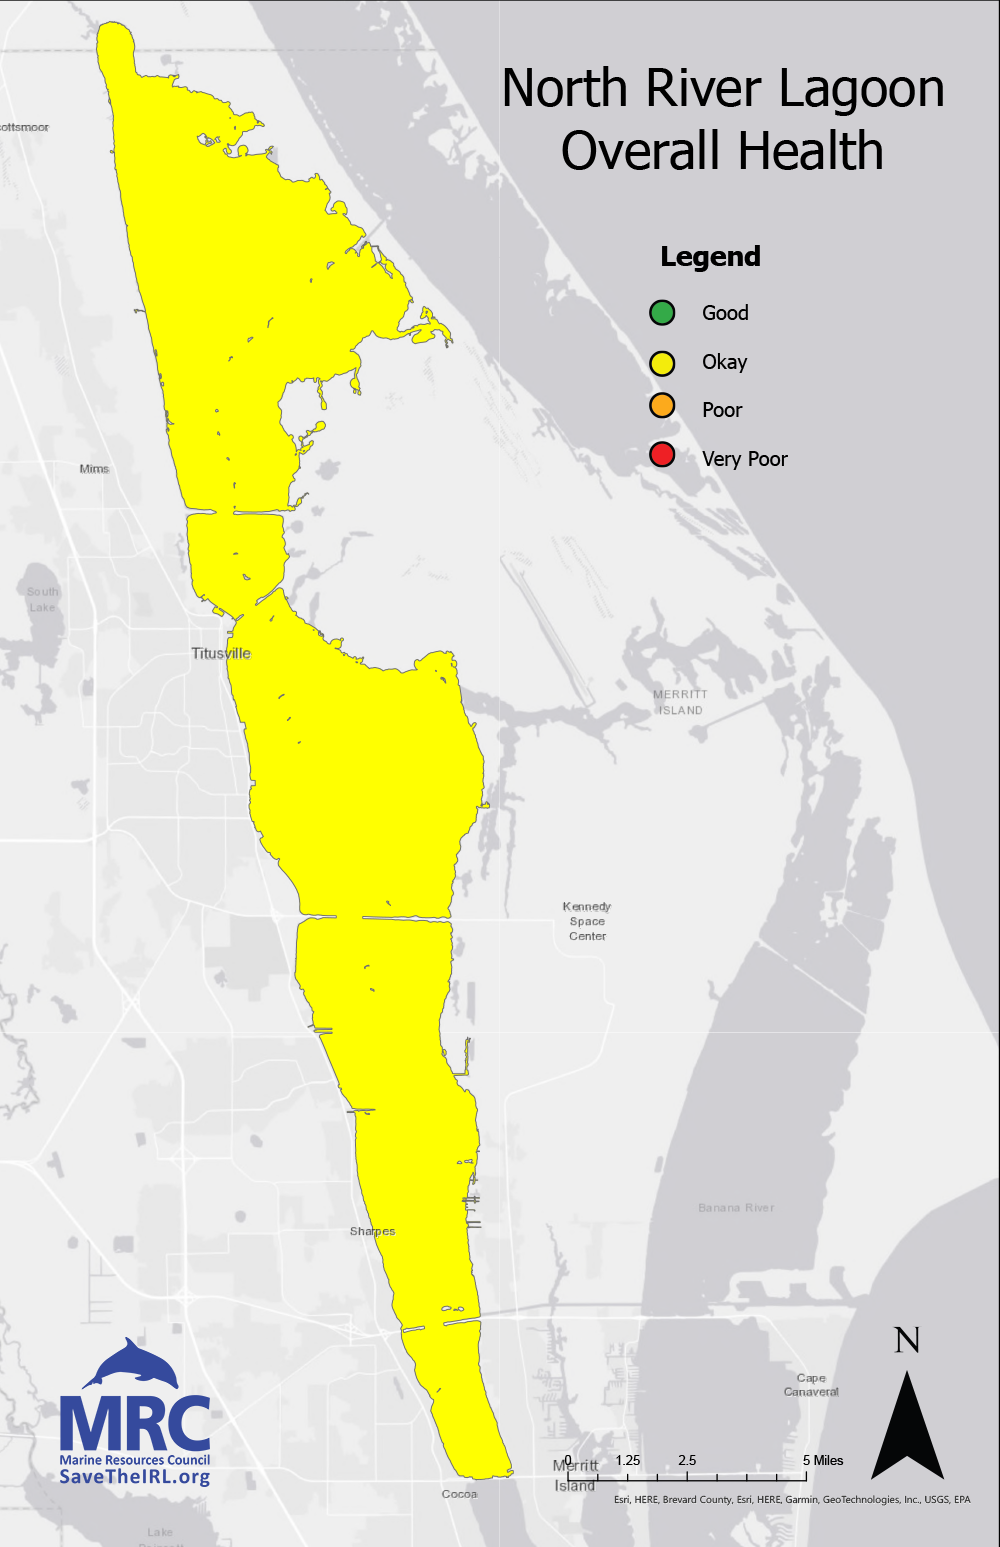
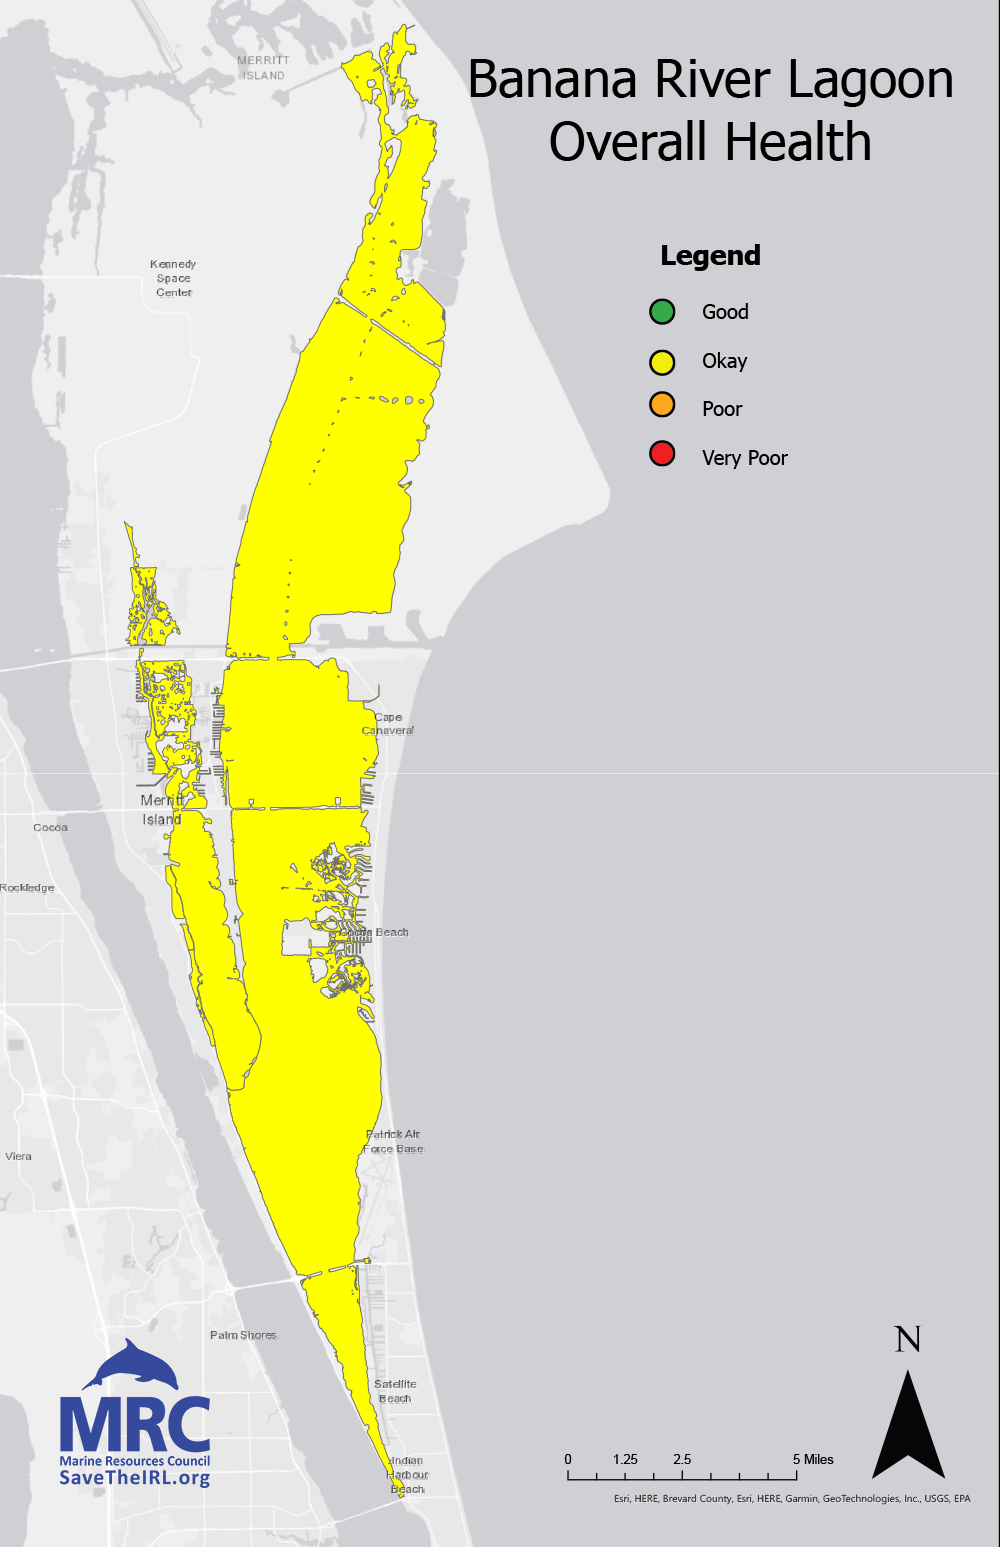
Health indicators were measured for each of the five sub-basins (north to south: Mosquito Lagoon, North Indian River Lagoon, Banana River Lagoon, Central Indian River Lagoon, and South Indian River Lagoon) on a scale from 0 (very poor) to 3 (good). Harmful algae, seagrass coverage, and water quality data were combined for a basin-wide average and are presented below. You can click on individual basins for more details, as well as view the 2024 Report for reference.
The Results Are In!
2025 was a year of general stability across the Indian River Lagoon. Overall basin health remained the same for four of the five basins and water quality assessments remained the same for all basins between the 2024 and 2025 Reports.
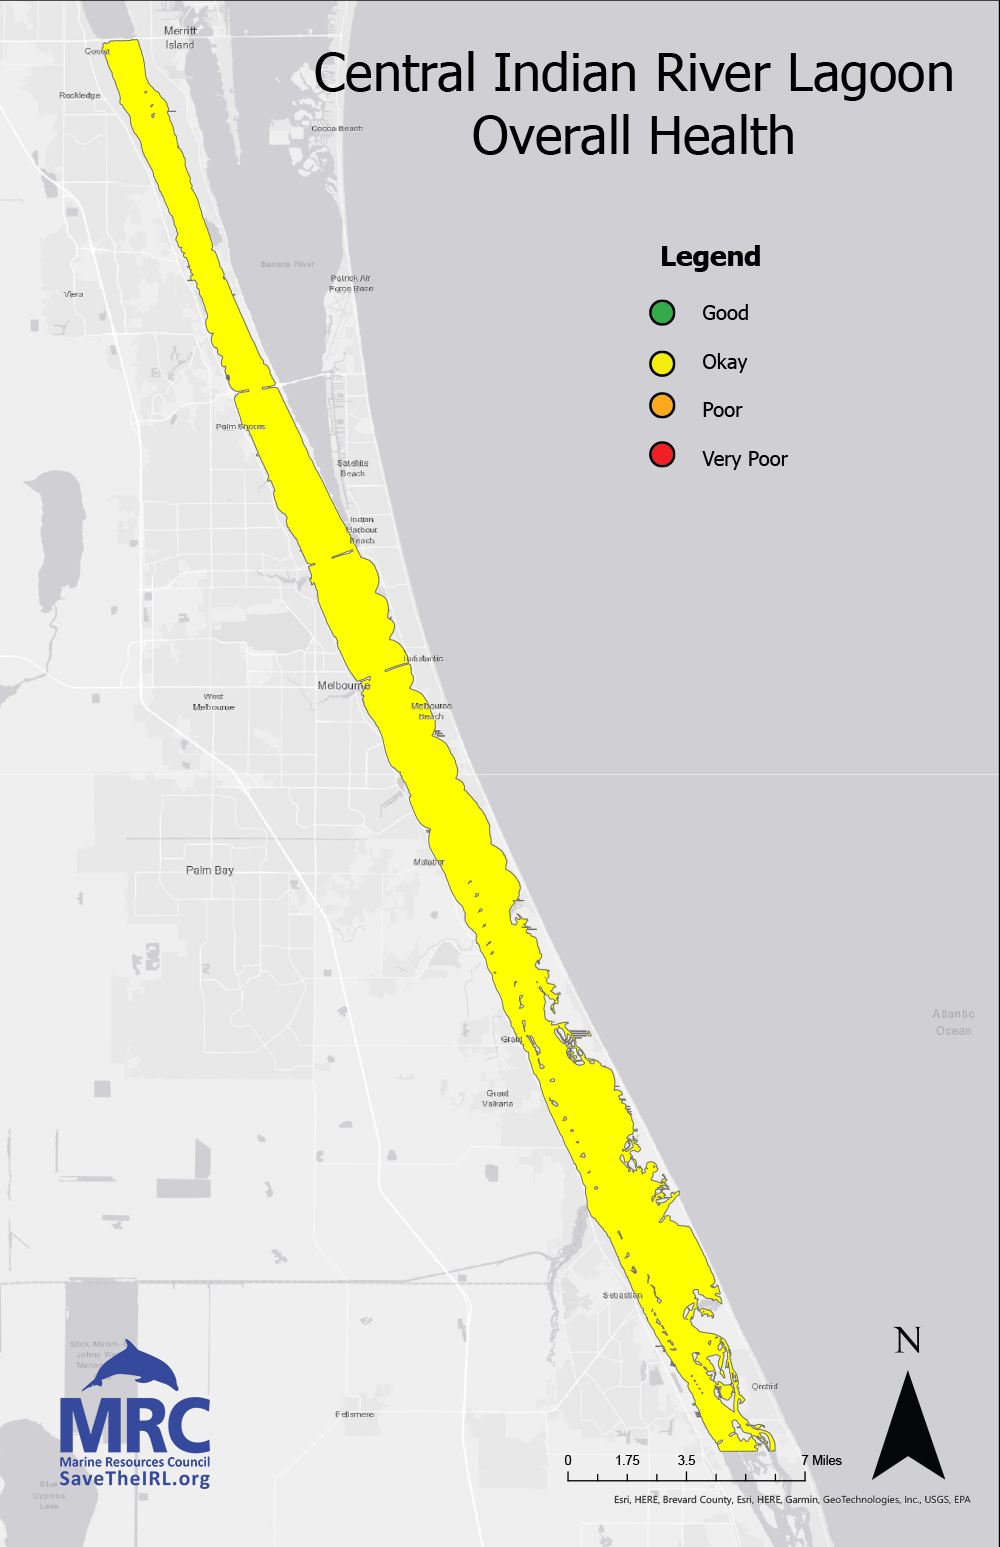
The Central Indian River Lagoon had a better year with overall health improving from “poor” to “okay” due to lower algae concentrations and increased seagrass coverage. However, water quality was the poorest in the Central IRL of all basins. Other basins only showed small shifts in water quality measurements (pH, Turbidity, Nitrogen, Phosphorus, Dissolved Oxygen, Chlorophyll-a) from last year’s report.
Stability despite Lake Okeechobee discharges, increased development, and a hot, dry summer is a testament to the many organizations and individuals working to reduce pollution and improve habitat health.


How You Can Help
Everyone has a role to play in restoring and protecting the Indian River Lagoon. In Spring 2025, Marine Resources Council launched Low Impact Living to approach Lagoon education, advocacy, and action on all scales: individual, family, community, and government. Check out our Low Impact Living website for tips, resources, or to request a presentation.
Important Considerations
It’s important to understand that a “good” health assessment doesn’t mean that problems are solved or improvement isn’t possible. We will need multiple “good” years strung together to see measurable and long-lasting ecosystem rebound. Likewise, a “poor” assessment doesn’t mean that efforts and money were wasted. We need to continue the projects and changes that we’ve started, like septic to sewer conversion, wastewater upgrades, stormwater improvements, living shorelines, native gardens, responsible land development, and others. And we’ll need new innovations and projects to continue restoring the Lagoon to a sustainable balance.
Lagoons are variable systems by nature that change year-to-year, season-to-season, day-to-day, and region-to-region. We avoided catastrophic algae blooms and fish kill events at least in part due to previous progress in Lagoon health.
2025 started with 84 billion gallons of water discharged from Lake Okeechobee into the St. Lucie River and Indian River Lagoon. The summer was hot and dry with the rainy season starting late, but we didn’t have any hurricanes. It was a steady year for Lagoon health compared to previous years, but we can’t predict next year and the work is far from done.
More About the Health Indicators
Harmful Algal Blooms (HABs)
In 2011, the Indian River Lagoon experienced the first catastrophic “super bloom” event. This event was caused by an increase of nutrients in the Lagoon resulting in a “bloom” of harmful algae. These algae physically blocked sunlight from reaching the bottom of the Lagoon, killing beneficial seagrass beds. As the algae decayed, decomposition used up oxygen in the water and caused fish deaths. Additional IRL “super bloom” events occurred in 2016, 2019, and 2020 leading to further loss of seagrass, fish, and manatees. In this Report, harmful algae concentrations were measured based on chlorophyll-a content in water quality data from Florida Department of Environmental Protection Watershed Information Network. Chlorophyll‑a is used in photosynthesis (how algae get their energy) and is a common measure of how much algae is in the water.
2025 continued to be a good year for HABs, meaning there were no significant increases in chlorophyll-a within any of the five basins. Both the Banana River Lagoon and Central Indian River Lagoon had declines in chlorophyll‑a concentrations. As a result, there were no significant fish kills or seagrass die-offs related to HABs.
Salinity
Because the Indian River Lagoon is a delicate mix of salt and fresh water (brackish), widespread and long-lasting changes in salinity can severely affect the plants and animals that live there—especially those that cannot swim away to more habitable areas. Because salinity can change so quickly across small areas, scientists have struggled with how to meaningfully report salinity data. At the suggestion of colleagues after releasing the 2024 Report, we are reporting median salinity with respect to key species in the Lagoon (click here if you need a refresher on median vs. mean).
Seagrass, oysters, clams, and mangroves are organisms that are essential for a healthy Lagoon. They are the focus of restoration efforts and cannot relocate quickly if local conditions become unhealthy. Each one grows best in different levels of saltiness (salinity). How long water stays in one area, how close the area is to ocean or freshwater rivers, and the amount of stormwater runoff from land all affect salinity and how well these species can survive.
Seagrass Coverage
Seagrass is essential to lagoon and estuary health because it (1) reduces erosion, (2) removes excess nutrients (that cause HABs) from water, (3) provides habitat for fish and shellfish, (4) provides food for manatees, sea turtles, and other animals, and (5) stores carbon. Water and sediment quality can affect seagrass growth, and because seagrass is easier to see, it’s commonly used as a habitat health indicator.
Seagrass data came from St. Johns River Water Management District (SJRWMD), who performs an extensive seagrass survey every two years. While these data could be outdated by the time we report them, this is the most thorough and consistently-collected dataset available. The data presented in this Report were assessed by comparing 2021 seagrass acreage to 2023 sea acreage. SJRWMD did perform a seagrass survey during Summer 2025, but those data won’t be available until Spring 2026.
You’ll notice that seagrass coverage varies greatly by region. It increased by over 50% in the Mosquito Lagoon and North IRL, slightly increased in the Banana River Lagoon and Central IRL, and slightly decreased in the Southern IRL. Scientists are still trying to figure out all the factors that contribute to why seagrass has recovered in some areas more than others, emphasizing how complex the Indian River Lagoon ecosystem is.
Sediment Health
Sediment is the sand and soil that make up the bottom of the Lagoon. When scientists assess sediment health, they look at the grain sizes (sand, silt, mud), organic matter (carbon, nitrogen, phosphorus), and at the animals that live in the sediments. Due to limited data availability, this Report only considers organic content. When there’s too much organic matter in the sediment from pollution like wastewater, fertilizers, or dead plant matter, the overall sediment health decreases and can’t support seagrass. This information is especially important for environmental efforts, like replanting seagrass or building living shorelines, to help restore the Lagoon’s ecosystem.
The sediment health data presented here came from research datasets collected by Florida Institute of Technology scientists. We are able to include considerably more data points than last year thanks to contributions from collaborators and increased interest in this type of data collection. However, because sediment health data are still so limited, they could not be used in the total basin assessment. To really understand the health of the IRL, we need to gather more sediment data from all parts of the Lagoon and consider more than just organic content.
Wastewater Spills
Wastewater is untreated, partially treated, or treated sewage that comes from residential and commercial sources. The wastewater data presented here represent spills or discharges into the IRL watershed during tropical storms and hurricanes from wastewater treatment facilities, or from accidental cuts or breaks in sewer lines. There are other sources of wastewater like discharges from live-aboard boats, but those are more difficult to track. Wastewater spills presented in this Report are from the Florida Department of Environmental Protection Watershed Information Network and are limited to spills that directly affect the IRL watershed.
From August 1, 2024 to August 1, 2025 there were 182 wastewater spills into or in areas leading to the Indian River Lagoon—some affecting more than one Lagoon basin. These spills vary from 5-gallons to over 3 million gallons. Small spills are often easily contained and cleaned up quickly. Larger spills can lead to significant amounts of nutrients entering the IRL. Nutrients that end up in the water and the sediment can cause harmful algae blooms, seagrass death, and fish kills. High concentrations of harmful bacteria like E. Coli can also be found in the Lagoon after large wastewater discharges. This emphasizes the importance of investing in wastewater infrastructure improvements to prevent spills, especially as residents switch from septic to sewer systems.
Water Quality
When scientists and environmental professionals use the term “water quality”, they are referring to how clean or healthy the water is. This is determined by what’s in the water. Good water quality means the water is safe for people, other animals, and plants. Poor water quality can kill the plants and animals that live in or use the water, including making water unsafe for humans to swim in or drink.
Scientists check water quality by looking at things like:
- Temperature: Water that is too hot or too cold can hurt plants and animals.
- pH level: This measures whether the water is too acidic or too basic. Most living things need a balanced pH (between 6.0 and 8.0) to survive.
- Dissolved oxygen levels: Fish and other creatures need oxygen in the water to live. Low oxygen can harm them.
- Pollutants: Things like dangerous chemicals, excess nutrients (nitrogen and phosphate), trash, and bacteria can lead to poor water quality.
Here, we assessed values of pH, turbidity (which relates to water clarity), total nitrogen (high nitrogen can lead to HABs), total phosphorus (too much phosphorus can cause a reduction in dissolved oxygen levels), dissolved oxygen, and chlorophyll-a (how much algae is in the water). Data were gathered from the Florida Department of Environmental Protection Watershed Information Network. Assessments are based on U.S. Environmental Protection Agency (EPA) water quality standards.
Good water quality is important for maintaining healthy ecosystems and for human use, like drinking, swimming, and fishing. Poor water quality can lead to problems like algae blooms, fish kills, and the spread of diseases. Overall water quality stayed the same across all basins from 2024 to 2025. The Central IRL still has “poor” water quality with all other basins categorized as “okay”. However, there were small changes in some measurements between years. For example, the Central IRL Dissolved Oxygen concentrations declined from “good” to “okay”, but Chlorophyll-a levels improved from “okay” to “good”.
Bacteria testing is not consistent across the Lagoon, but Marine Resources Council partners with Surfrider Foundation Space Coast to collect bacteria data from Lagoon and tributary waters. Check out Space Coast Blue Water Task Force for bi-weekly bacteria level reports.
Interested In Learning More?
Click on each basin on the map above to find out more about the five health indicators for each Indian River Lagoon basin. If you want to learn more about how health indicators were assessed, check out our methods.
Thank you to partner organizations, government agencies, collaborators, and many others who provided data and guidance for the Report. We couldn’t have done it without you! Please see our full list of acknowledgements included with our methods.
Your Financial Support Makes It Happen!
Donate to become an Annual Member Today!
Marine Resources Council (MRC) coordinates Lagoon-wide efforts to Save the Indian River Lagoon, but we need your support to succeed. It will take a community to save the Lagoon, working at all levels.
MRC is holding government workshops, coordinating diverse stakeholder groups, showcasing community leaders, and working with businesses and individuals to encourage actions that will help save the Indian River Lagoon.
This website is managed by the Marine Resources Council, a 501(c)(3) nonprofit organization that has been dedicated to protecting and restoring the Indian River Lagoon since 1983.
Marine Resources Council • 3275 Dixie Hwy NE, Palm Bay, FL 32905.
Community Workshops
Science
LagoonWatch
2024 Report
IRL Action Assemblies
Restoration
Mangrove Nursery
Education
Lagoon at Noon
Low Impact Development
2026 LID Conference
2025 LID Conference
2024 LID Conference
2023 LID Conference
2022 LID Conference
2021 LID Conference
Teacher Resources
Rain Barrels
Site development by Editype.